Pull up three real estate data sites for Rosemary Beach on the same afternoon and you will walk away with three different stories about the same town. One says days on market dropped by more than half in the past year. Another says it barely moved. A third shows the average sale price falling by double digits while the median climbed by roughly the same amount, in the same window. None of these sources made an error. They are all reporting real numbers pulled from the same small pool of transactions, and that pool is the whole problem.
If you are comparing Rosemary Beach to other 30A communities before you buy, this matters more than it looks. A market this size does not behave like a normal residential market, and reading it like one will lead you to the wrong conclusion about whether now is a good time to move.
The numbers, side by side
Here is what a buyer researching Rosemary Beach in August 2026 actually finds when checking multiple sources in the same week:
| Source (snapshot date) | Price figure | Days on market | What's being counted |
|---|---|---|---|
| Portal market-trends data, April 2026 | $3.42M median sale price | 83 days, down from 142 the year before | 23 homes sold that month |
| Portal neighborhood overview, August 2026 | $2.74M median list price | 178 days, roughly flat year over year | Active listings, not closed sales |
| Live MLS feed, August 16, 2026 | $2.70M median list price | 112 days average | 21 homes listed |
| Aggregator historical data, most recent reported month (October 2025) | $2.9M median sale price, up 13.4% year over year | 93 days average | 5 homes sold, down from 8 the prior year |
Look at that last row again. Five sales. That is the entire dataset behind a headline claiming the market moved 13.4% in a single direction. One additional closing at a different price point, or one fewer, changes that percentage more than any real shift in buyer demand would. That same October 2025 snapshot also showed the average sale price down 14.2% year over year, even as the median climbed 13.4%, a contradiction that only makes sense once you realize average and median are drawing from the same razor-thin handful of closings and one high or low outlier moves each of them differently.
This is not a data quality problem you can shop your way out of by finding the "right" website. It is a structural feature of the market itself.
Why a five-sale month tells you almost nothing on its own
Rosemary Beach does not have hundreds of closings to smooth out. Some months it has single digits. When your sample size is that small, a single $8 million Gulf-front closing sitting next to a $1.4 million interior cottage sale will drag the average and the median in opposite directions, even though nothing about underlying value changed. Add one more sale next month at a different price tier and last month's percentage swing reverses itself entirely.
Compare that to the 30A corridor as a whole, where a March 2026 market update put average days on market at 144 and the median at 96, with sold-to-list ratios sitting in the low 90 percent range. Those corridor-wide figures are built from hundreds of transactions across Rosemary Beach, Alys Beach, Seacrest, WaterSound, Seaside, and the rest of South Walton combined. They move slowly and mean something when they shift. Rosemary Beach's own number, built from a handful of closings, will bounce around that corridor baseline by wide margins purely on volume, not on sentiment.
This is the part most buyers miss when they compare a single month's headline for Rosemary Beach against the same month's headline for a larger community. They are comparing a number built on statistical noise to one built on signal.
The town plan is why the sample stays small
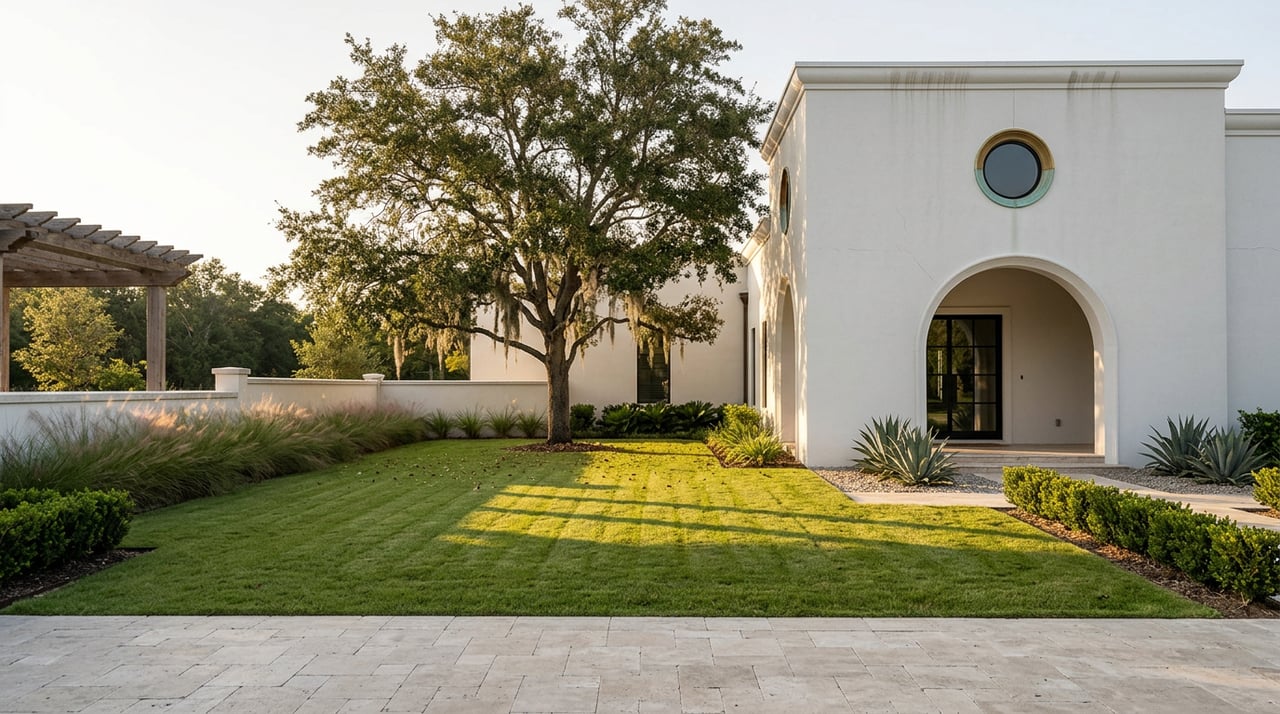
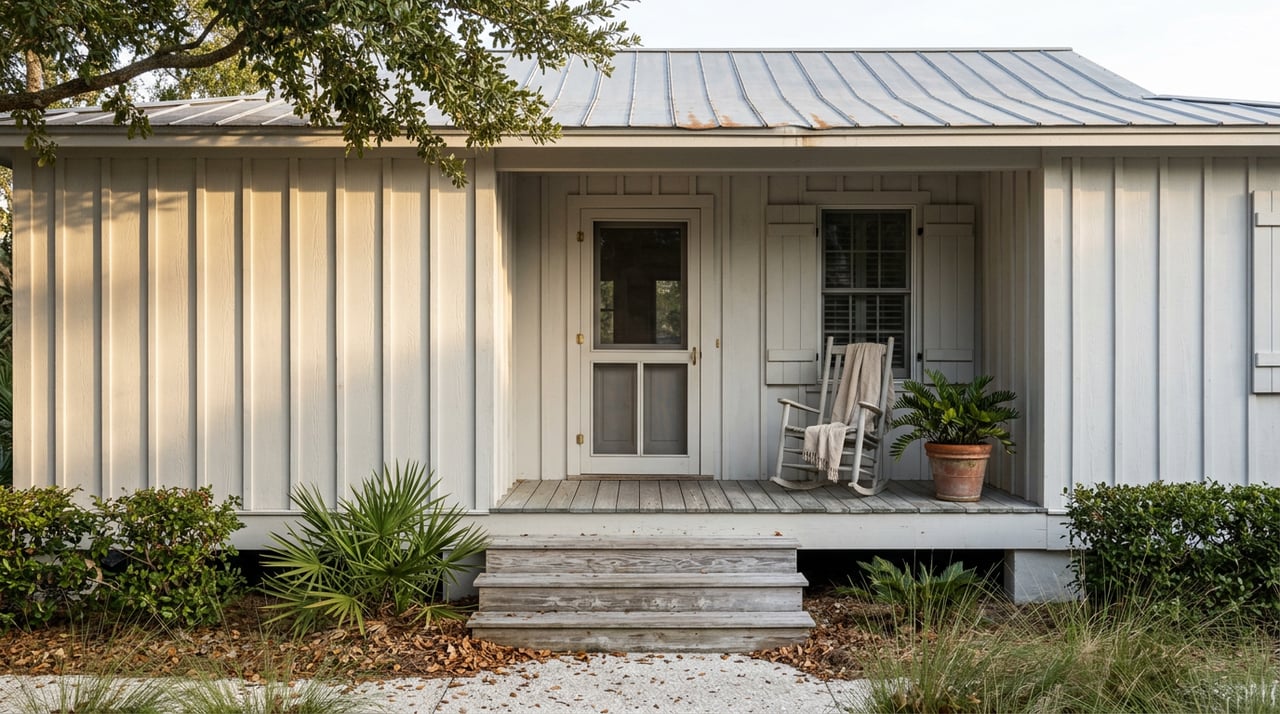
Rosemary Beach was laid out under a strict urban code from its founding in the mid-1990s, designed by Andrés Duany and Elizabeth Plater-Zyberk around a master plan of twelve distinct building types that dictate the placement, scale, and materials of every home in the community. Every new home and any exterior change still has to conform to that code before construction begins. Parking sits in alleyways behind homes rather than on the street, and the town has banned golf carts since 2014 to keep its network of pedestrian lanes and boardwalks car-free.
The practical effect for buyers is that Rosemary Beach cannot expand its inventory the way a typical subdivision does when demand rises. There is no builder stepping in to add forty units that match what's selling. The town is close to built out, which means the mix of what comes to market in any given month, courtyard cottage, interior single-family, or Gulf-front estate, is largely fixed rather than responsive. That fixed, small, and uneven mix is exactly what produces the price swings and days-on-market contradictions in the table above. It is not a symptom of instability. It is what a scarce, code-controlled inventory looks like when you measure it monthly instead of over a longer window.
What to track instead of the headline number
If the single-month median and days-on-market figures for Rosemary Beach are this noisy, what should a buyer or seller actually watch?
Active listing count, not the percentage change in it. Rosemary Beach has been sitting in the low twenties to low thirties in active listings through 2026 depending on the source and the week. That absolute number tells you supply is tight regardless of which direction last month's percentage swung.
Price per square foot, sorted by building type. A blended median across cottages and Gulf-front estates hides more than it reveals. Ask what an interior courtyard home is running per square foot compared to a beachfront estate, and track that separately. One recent snapshot showed average price per square foot in the low $1,400s across all listed inventory, but that figure means very little without knowing which building types were included.
The corridor's sold-to-list ratio, not Rosemary's alone. With so few Rosemary Beach transactions to draw from, the corridor-wide ratio (low 90 percent range as of the most recent update) is a more reliable read on how much negotiating room actually exists right now than any single-town number built on five or twenty-three sales.
A multi-month trend, not a single snapshot. Given how much one or two closings can swing Rosemary's own numbers, no single month should be treated as a verdict on the market. Ask any source for at least a rolling quarter before drawing a conclusion.
None of this means Rosemary Beach is a riskier place to buy. If anything, the architectural code that keeps the sample size small is the same mechanism that has kept the town from overbuilding and diluting long-term value the way less restricted communities sometimes do. It just means the market needs to be read differently, with attention to what the numbers are built on rather than what they say at face value.
Frequently asked questions
Is the Rosemary Beach market currently up or down? Depending on which figure you isolate, an argument can be made for either. The more accurate answer is that the market is stable and tightly supplied, and the wide swings in reported percentages reflect a small transaction count rather than a genuine shift in buyer demand.
Why do real estate sites disagree so much on days on market for Rosemary Beach specifically? Some sites report active listing data, others report closed sales, and the closed-sales pool each month is small enough that a single transaction can move the average by weeks. Larger communities average out this noise. Rosemary Beach does not have enough volume to do the same.
What single number is most useful if I only have time to check one? Active listing count. It is far less volatile than price or days-on-market figures and gives a direct read on how much genuine choice exists in the market at any given time.
Reading a market this tightly held requires more than a portal screenshot. If you are weighing Rosemary Beach against another point on the 30A corridor and want the actual mechanics behind this month's numbers, not just the headline, The Blankenship Group can walk you through what the current inventory and building-type breakdown mean for your specific search. Request a private consultation to start that conversation.